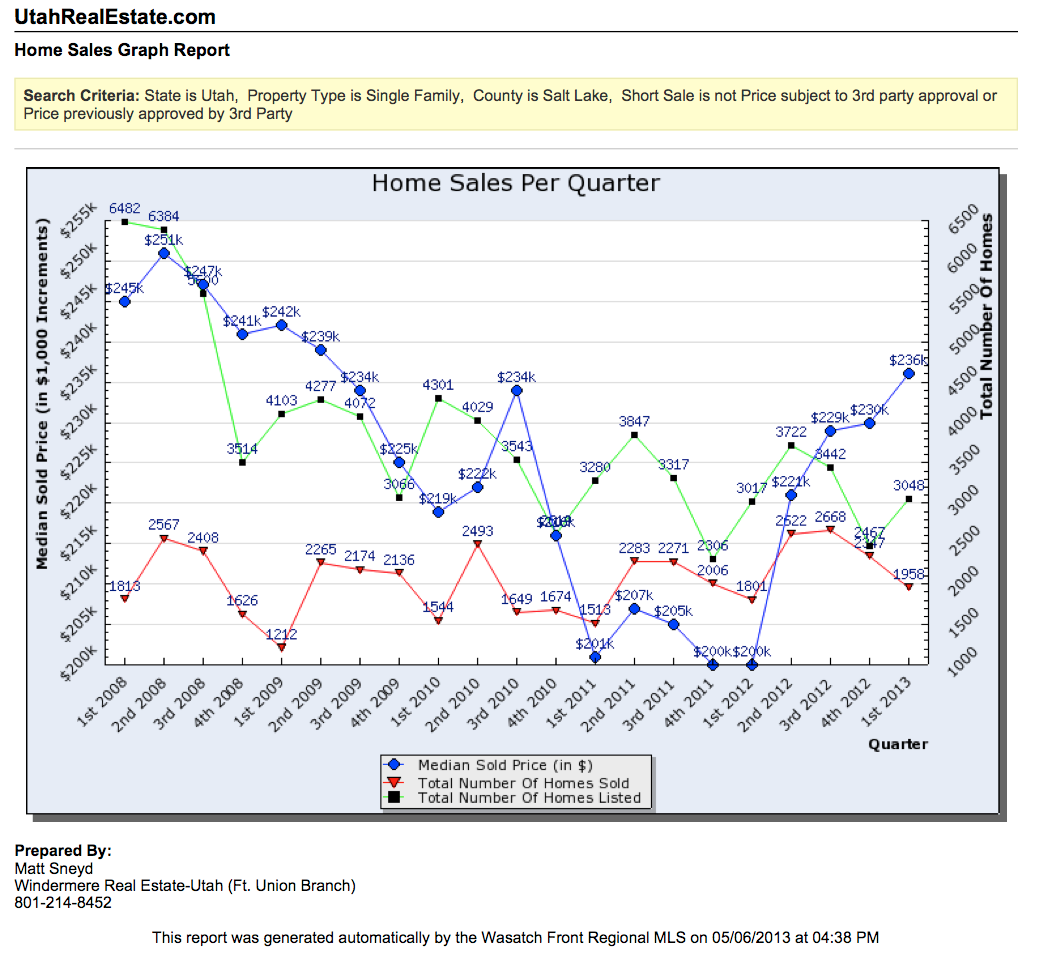
The market is hot. If you look at the graph above, you will see that we hit rock bottom Q4 2011 & Q1 2012, just over a year ago. Since then, we have been riding a reminiscing wave, remembering when I first got in the business at 19 years old. We took a steady decline from 2008 with a slight uptick in 2010 for the first-time homebuyers tax credit, and then bounced around the bottom after that. If you noticed back on march 2nd, 2012 I wrote on my Facebook page how low inventory was. It was actually at its lowest levels since ’96.
The thing to notice on this graph is simple economics at their finest. Supply & demand. Supply bottomed out in the 4th quarter of 2011 and we have been on a quick and steady rise since. Inventory jumped slightly in the warmer months, which is par for the course in Utah. We had another dip in Q4 of 2012, which has driven the feeding frenzy our buyers are experiencing today. Demand has been on the rise, even though it’s technically not represented on this chart. You can tell the demand is high is by the rise in the median home price. It has risen over 25% year over year. Jumping from $200k to $236k, and only $15k off the peak in 2008.
So what does this all mean to you? Sell, Sell, Sell! If you have a house to sell you should seriously consider giving us a call to see what your home is worth. I just read an article that 10,000 baby boomers are moving into retirement homes each day. So for all of you out there with parents in that situation make sure you give us a call too. Whether the home is updated and in good selling condition or completely outdated with tons of junk everywhere we have solutions for you.
For more information on why now is a good time to sell see my other article with the top five reasons to sell now.